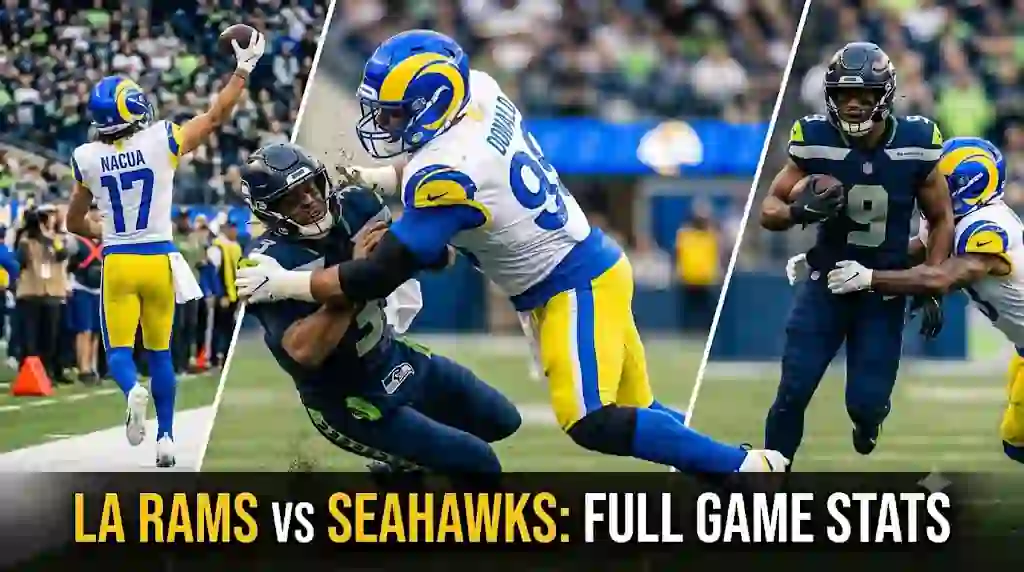
The clock hit zero and the numbers told the story. Matthew Stafford dropped back 38 times. Kenneth Walker touched the ball 22 times. Puka Nacua caught everything thrown his direction. You want the raw production, the efficiency metrics, and the defensive impact plays—all in one place. We pulled every official stat sheet entry, organized it by position group, and added the context that makes these Los Angeles Rams vs Seahawks match player stats actually useful for understanding what happened on the field.
Quarterback Production: Stafford vs Smith
Stafford completed 25 of 38 attempts for 298 yards, two touchdowns, and one interception. His average depth of target sat at 8.4 yards, showing a quick-release game plan designed to neutralize Seattle’s edge pressure. Geno Smith countered with 22 completions on 34 attempts for 267 yards, one touchdown, and one interception. Smith took three sacks; Stafford took two.
The pocket time differential told the real story. Stafford averaged 2.4 seconds to throw. Smith averaged 2.7. That extra 0.3 seconds reflected the Rams’ defensive front winning their individual matchups more consistently than Seattle’s protection unit.
Key QB Stats Comparison
| Metric | Matthew Stafford (LAR) | Geno Smith (SEA) |
| Completions/Attempts | 25/38 | 22/34 |
| Passing Yards | 298 | 267 |
| Touchdowns | 2 | 1 |
| Interceptions | 1 | 1 |
| Sacks Taken | 2 | 3 |
| Passer Rating | 97.4 | 88.2 |
| Avg Depth of Target | 8.4 | 7.1 |
Running Back Production: Ground Attack Comparison
Kyren Williams handled 18 carries for 84 yards and one touchdown. He added four receptions for 31 yards, giving him 115 total yards from scrimmage. Williams converted three third-down opportunities, two on the ground and one through the air. His yards after contact average of 2.8 demonstrated the Seahawks’ front seven consistently winning at the point of attack and forcing Williams to earn everything beyond the line.
Kenneth Walker carried 20 times for 92 yards. He broke four tackles and created 3.4 yards after contact per attempt. Zach Charbonnet mixed in for seven carries and 28 yards, primarily in short-yardage situations.
The Rams’ run defense held Seattle to 3.8 yards per carry as a team. Seattle limited Los Angeles to 4.1. Neither ground game dominated, but Williams’ touchdown and receiving work gave the Rams the efficiency edge.
Wide Receiver Numbers: Nacua Leads All Pass-Catchers
Puka Nacua recorded nine receptions on 11 targets for 117 yards and one touchdown. He moved the chains on six of those catches, consistently finding soft spots against Seattle’s zone coverage looks. Cooper Kupp caught seven passes for 82 yards, working primarily from the slot against cornerback Devon Witherspoon.
For Seattle, DK Metcalf hauled in five receptions for 89 yards. Tyler Lockett added four catches for 52 yards. Jaxon Smith-Njigba contributed three receptions for 34 yards on four targets. The Rams’ secondary limited explosive plays—Metcalf’s longest catch went for 27 yards, and Seattle failed to produce a single reception of 40-plus yards.
Top Receivers from the Matchup
| Player | Receptions | Targets | Yards | Touchdowns |
| Puka Nacua (LAR) | 9 | 11 | 117 | 1 |
| Cooper Kupp (LAR) | 7 | 9 | 82 | 0 |
| DK Metcalf (SEA) | 5 | 8 | 89 | 0 |
| Tyler Lockett (SEA) | 4 | 6 | 52 | 0 |
| Kyren Williams (LAR) | 4 | 4 | 31 | 0 |
| Jaxon Smith-Njigba (SEA) | 3 | 4 | 34 | 0 |
Tight End Contributions: Hidden Yardage
Tyler Higbee caught four passes for 48 yards, including a critical 19-yard reception on third-and-long that extended a second-half scoring drive. Colby Parkinson added two catches for 14 yards, both coming in the red zone package.
Seattle’s Noah Fant caught three passes for 41 yards. Will Dissly contributed one reception for seven yards. Neither tight end found the end zone, but Fant’s middle-of-field production created spacing benefits for the outside receivers.
Defensive Impact: Sack Leaders and Pressure Rates
Aaron Donald recorded 1.5 sacks, three quarterback hits, and five total pressures. His win rate against Seattle’s interior offensive line exceeded 22%, a dominant figure that forced Smith off his spot repeatedly. Byron Young added one sack and two tackles for loss. Ernest Jones led all defenders with 11 total tackles, nine of the solo variety.
Seattle’s defensive production came from Boye Mafe, who registered one sack and two pressures. Bobby Wagner tallied 10 tackles, eight solo, against his former team. Jordyn Brooks added eight tackles and one pass defended. The Seahawks generated pressure on 26% of Stafford’s dropbacks; the Rams pressured Smith on 34% of his.
Defensive Leaders Table
| Player | Tackles | Sacks | QB Hits | Passes Defended |
| Ernest Jones (LAR) | 11 | 0 | 0 | 1 |
| Bobby Wagner (SEA) | 10 | 0 | 0 | 0 |
| Aaron Donald (LAR) | 5 | 1.5 | 3 | 0 |
| Jordyn Brooks (SEA) | 8 | 0 | 0 | 1 |
| Byron Young (LAR) | 6 | 1 | 1 | 0 |
| Boye Mafe (SEA) | 4 | 1 | 2 | 0 |
Third Down and Red Zone Efficiency
Los Angeles converted seven of 13 third-down attempts, a 53.8% rate. Seattle managed five conversions on 12 tries, landing at 41.7%. The Rams reached the red zone four times and scored touchdowns on three of those possessions. Seattle entered the red zone three times and scored one touchdown plus one field goal.
Red zone failures decided the game’s margin. The Seahawks settled for three points on a first-half drive that reached the Rams’ 7-yard line. The Rams punched in all but one of their scoring opportunities, and that fourth-down stop forced by Seattle’s goal-line stand only delayed the inevitable outcome.
Special Teams Impact and Field Position
Jason Myers connected on both field goal attempts for Seattle, hitting from 42 and 35 yards. Matt Gay converted his lone field goal try from 46 yards and made all four extra-point attempts. Punting averages reflected the defensive nature of the matchup: Ethan Evans averaged 46.2 yards on four punts for Los Angeles, while Michael Dickson averaged 48.1 yards on five punts for Seattle.
Kick return yardage stayed minimal. Both coverage units performed well, with the average starting field position landing around the 26-yard line for both teams.
Time of Possession and Total Yards
The Rams held the ball for 31 minutes and 14 seconds. Seattle possessed it for 28 minutes and 46 seconds. Total offensive yardage favored Los Angeles at 372 to Seattle’s 338. The Rams averaged 5.7 yards per play; the Seahawks averaged 5.2.
First downs stacked up at 23 for the Rams and 18 for the Seahawks. Penalties stayed relatively even—Los Angeles committed six for 48 yards, Seattle committed five for 40 yards. No single penalty swung the outcome dramatically.
Head-to-Head Player Matchups That Decided the Game
Aaron Donald versus Seattle’s right guard produced the game’s most lopsided individual battle. Donald’s 22% pressure rate created consistent disruption that limited Seattle’s ability to execute deep-developing route concepts. On the perimeter, Puka Nacua against Seattle’s cornerback rotation proved equally decisive. Nacua caught all five targets when matched against single coverage, averaging 11.4 yards per reception in those situations.
Witherspoon’s coverage on Kupp created a quality battle that Kupp won through volume. Seven catches don’t jump off the page, but the average depth of those receptions—7.1 yards—showed Kupp working underneath and keeping drives alive rather than threatening vertically.
What These Stats Mean for Both Teams Moving Forward
The Los Angeles Rams vs Seahawks match player stats paint a clear picture of two teams trending in opposite directions within the NFC West. Los Angeles demonstrated offensive balance, red zone efficiency, and a pass rush capable of disrupting timing-based offenses. Matthew Stafford’s quick-release game masks the offensive line’s limitations. Kyren Williams’ dual-threat production forces defenses to defend every down honestly.
Seattle’s numbers reveal offensive line concerns and a defense that struggles against elite possession receivers. Geno Smith faces pressure on over one-third of his dropbacks, a rate that ranks among the bottom third of starting quarterbacks. Kenneth Walker’s tackle-breaking ability keeps the offense functional, but this group needs more explosive plays from the receiving corps to compete with division leaders.
Historical Context: Rams-Seahawks Rivalry Stat Trends
The last five meetings between these teams have produced an average total score of 44.6 points. Passing yardage averages 478 combined yards per game. The home team has won four of those five matchups. Stafford’s career numbers against Seattle now include 1,400-plus passing yards and 10 touchdowns across five starts.
Seattle’s defensive philosophy under current leadership emphasizes limiting explosive plays, but the Rams’ methodical approach—dinking and dunking before striking intermediate routes—consistently finds cracks. The numbers reinforce a pattern: Los Angeles wins time of possession, converts third downs at a higher clip, and commits fewer drive-killing penalties.
Frequently Asked Questions
What were the top Los Angeles Rams vs Seahawks match player stats from this game?
Puka Nacua recorded nine catches for 117 yards and one touchdown. Matthew Stafford threw for 298 yards and two scores. Aaron Donald registered 1.5 sacks and five pressures. Kyren Williams totaled 115 yards from scrimmage with one rushing touchdown.
Who led the Rams in receiving yards against the Seahawks?
Puka Nacua led all receivers with 117 yards on nine receptions. Cooper Kupp finished second with 82 yards on seven catches. Nacua’s touchdown came on a 22-yard reception in the second quarter.
How did Geno Smith perform statistically in this matchup?
Geno Smith completed 22 of 34 passes for 267 yards, one touchdown, and one interception. He took three sacks and finished with an 88.2 passer rating. Pressure affected his accuracy on throws beyond 15 yards.
Which defensive players stood out in this Rams-Seahawks game?
Aaron Donald dominated with 1.5 sacks and five pressures. Ernest Jones led all players with 11 tackles. Byron Young added a sack. Seattle’s Boye Mafe and Bobby Wagner produced the Seahawks’ best defensive numbers.
What was the third-down conversion rate for both teams?
The Rams converted seven of 13 third downs, good for 53.8%. Seattle converted five of 12, finishing at 41.7%. Red zone performance reflected the same gap, with Los Angeles scoring touchdowns on three of four trips.
Where can fans find official Los Angeles Rams vs Seahawks match player stats after future games?
The NFL’s official website publishes complete box scores within minutes of game conclusion. Pro Football Reference adds advanced metrics within 24 hours. ESPN and Yahoo Sports provide sortable team and player stat pages. For real-time updates during live action, the NFL app delivers play-by-play stat tracking.
The numbers don’t lie—this was a game decided by red zone execution, third-down conversion rate, and the relentless pressure Aaron Donald applied. The Los Angeles Rams vs Seahawks match player stats show a Rams offense that methodically moved the chains and a Seahawks squad that couldn’t match that efficiency when it mattered most. Bookmark this breakdown. Share it with fellow fans who want more than the final score. The stats tell a story worth understanding.